
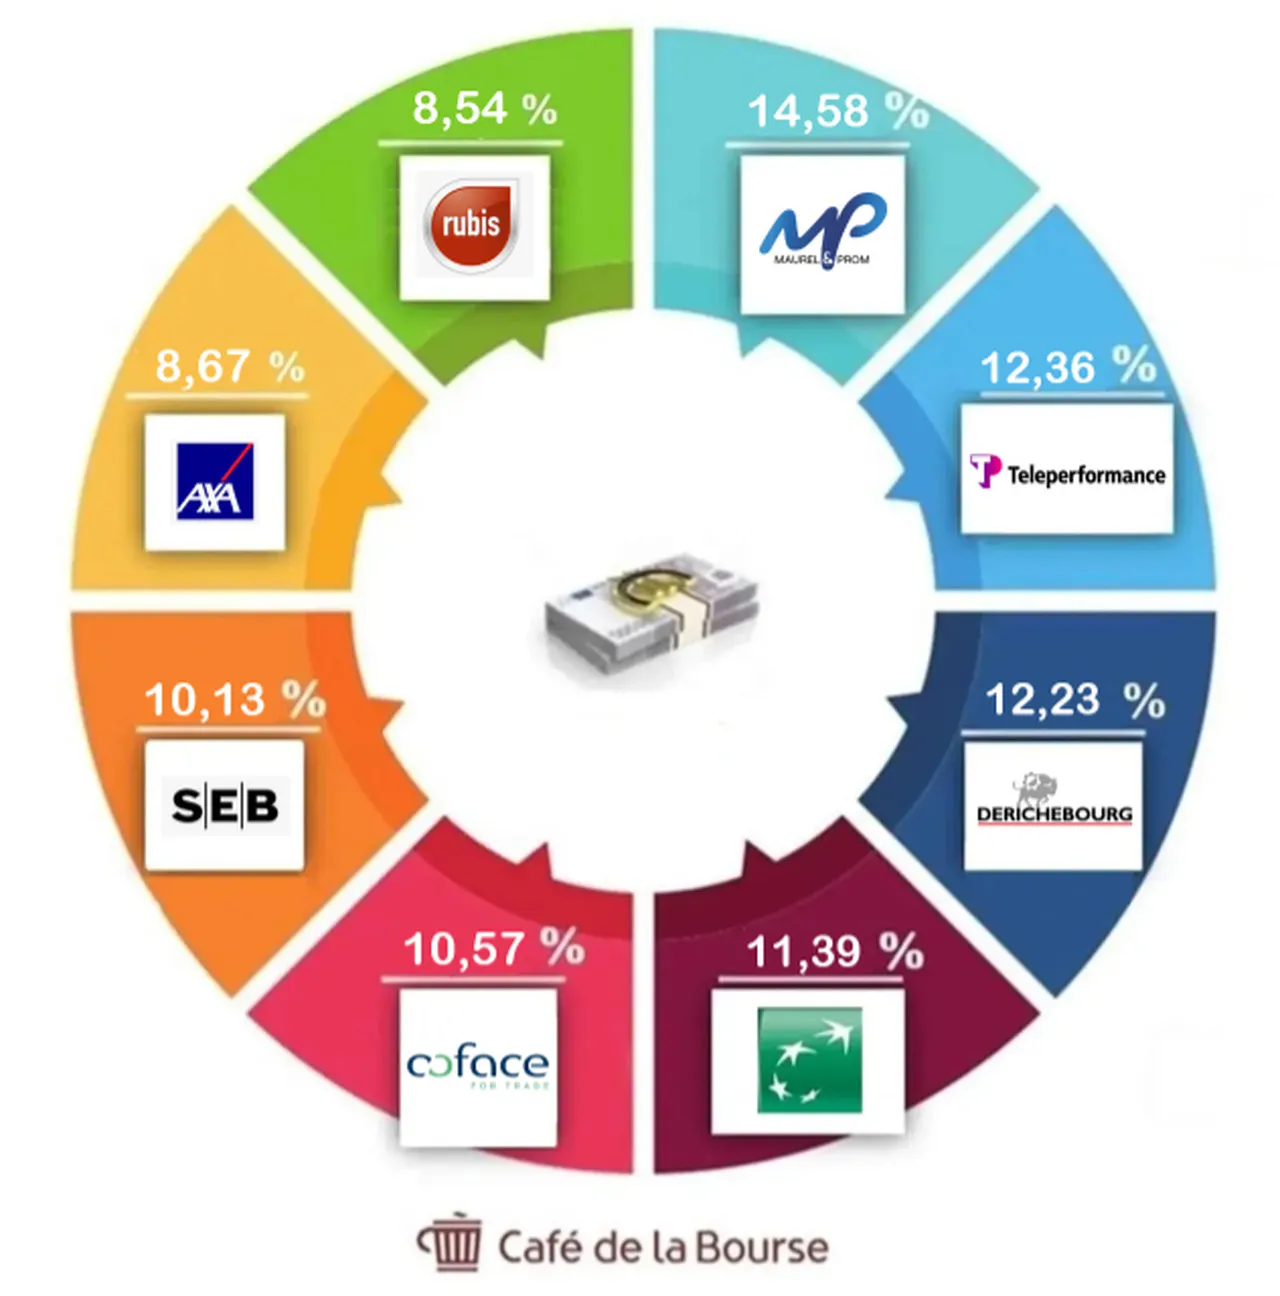
Discover Café de la Bourse’s ranking of eight French companies, whose market capitalization exceeds one billion euros, offering a five-year average profitability expressed as net profit that is positive, ranging from 8.54% to 14.58%.
You will be able to position yourself on these companies through one of the best PEA accounts, to benefit from the tax advantage of this wrapper. You can of course also adopt more complex investment strategies on these securities, via derivatives, by investing from one of the best stock accounts. Be careful to choose one of the best stock brokers to enjoy a wide range of assets, at reasonable fees, while benefiting from services and tools suited to your investor profile.
What is a profitable company on the Stock Market?
The profitability figures expressed as percentages in this article have been calculated as an average over 5 years. The goal is to obtain a smoother, and therefore more stable, view of the performances of the analyzed companies according to this formula: Average earnings of the last 5 years / market capitalization.
Profits correspond to the money that the company was able to retain after deducting all of its charges from its revenue.
Market capitalization corresponds to the current price of the company on the stock market and equals the number of shares outstanding × the stock price.
The ratio between the two indicates the profitability expressed as a percentage for a year.
The PER (Price to Earnings Ratio) have also been calculated based on the average earnings over the last 5 years.
This ratio can be calculated by dividing the stock price by its EPS (Earnings Per Share). The PERs in this article have, however, been calculated as follows: market capitalization / average earnings over the last 5 years.
How did Café de la Bourse prepare this ranking of the most profitable French companies on the Stock Market?

This analysis was conducted on October 20, 2026. From the following day, these profitability ratios may already have varied, as they are calculated using the market capitalizations of companies that are constantly evolving.
If the stock prices of these companies rise in subsequent sessions, their profitability will decline—and conversely if prices fall.
Note : we averaged five-year profits to smooth the performance of these companies over time, and excluded companies that experienced one or more years of loss. We also removed from profits high, non-recurring, exceptional gains not related to ordinary activities.
Furthermore, we studied only companies whose shares had a positive price change over the past year (October 20, 2025 – October 20, 2026).
Important : this ranking is based on the profits of the companies, and not their dividends. The percentages expressed therefore correspond to profitability, and not to dividend yields.
Best broker comparison for investing in stocks on the Stock Market
| Top Stock Brokers | Current Offers | View Offers |
|---|---|---|
| 1 Veolia share offered with a minimum deposit of €50. Capital at risk* | ||
| Get up to $500 of free assets. Capital at risk* | ||
 |
Open your Regular Savings Plan in stocks and ETFs with zero fees and receive up to 20 free shares with promo code WELCOME 50. Capital at risk. | |
 |
3% interest on your uninvested cash + invest from €1 in stocks, ETFs, regular savings plans, cryptos and trading products. Capital at risk* | |
 |
US stocks from $1 official + support with an expert on the platform. Capital at risk* | |
 |
0.08% on French and US stocks + Saxo Turbos at €0 + up to 2.66% interest on cash. Capital at risk* | |
| Invest with 0€ commission and 5% interest on invested cash. Capital at risk* | ||
 |
From €0.99 per stock order + transfer fees reimbursed and free training. Capital at risk* | |
 |
€100 in brokerage fees reimbursed for new clients under conditions + €1 brokerage commission on French, US stocks and ETFs. Investing carries a risk of loss* | |
 |
Transfer fees reimbursed 2x + from €0 per stock order with Boursomarkets. Investing carries a risk of loss* |
*See terms on the site.
Ranking of the 8 most profitable French stocks on the Stock Market by their profitability
Maurel & Prom Share
Teleperformance Share
Derichebourg Share
BNP Paribas Share
Coface Share
SEB Share
AXA Share
Rubis Share
The elements presented in this ranking are provided for informational and educational purposes only. They do not constitute investment advice or a recommendation to buy or sell any financial instruments. Finally, please note that past performance is no guarantee of future results and that any investment in the stock market carries a risk of capital loss.
1. Maurel & Prom Share: a specialized oil & gas operator
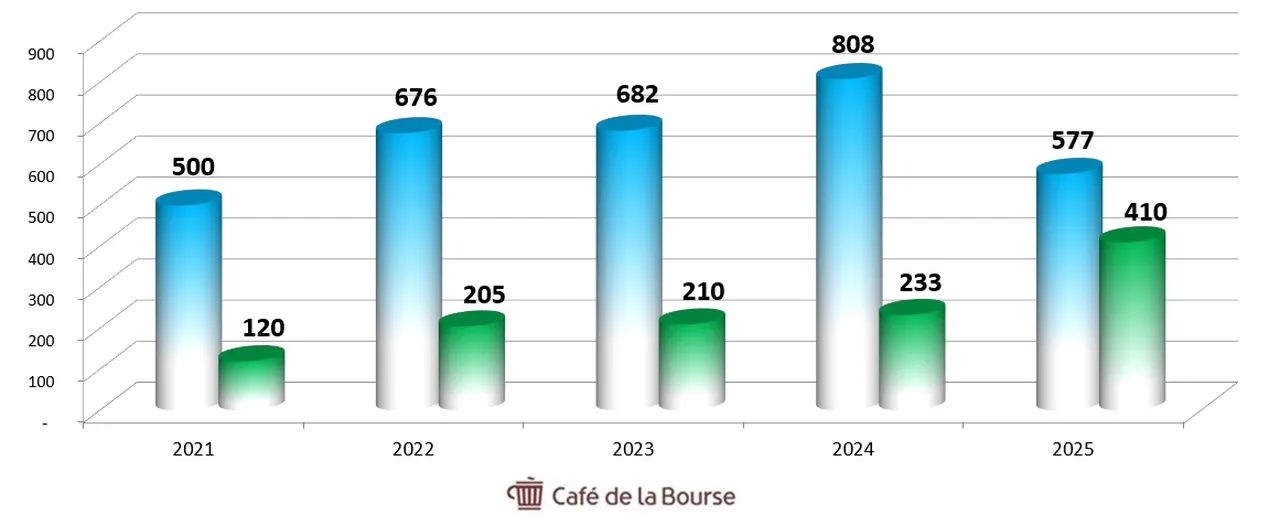
Average profit over 5 years (2021 – 2025): 235.6 million euros
Market capitalization as of 20 October 2026: 1,616 million euros
Average profitability over 5 years: 14.58%
Average P/E over 5 years: 6.86
Maurel & Prom is an independent French company engaged in oil and gas exploration and production, with activity mainly concentrated in Africa (Gabon, Angola, Tanzania) and a stake in Nigerian Seplat.
Revenue and profits of Maurel & Prom between 2021 and 2025
(in millions of euros, net profit, annual accounts closed on 31/12)
2. Teleperformance Share: specialist in outsourced customer relations
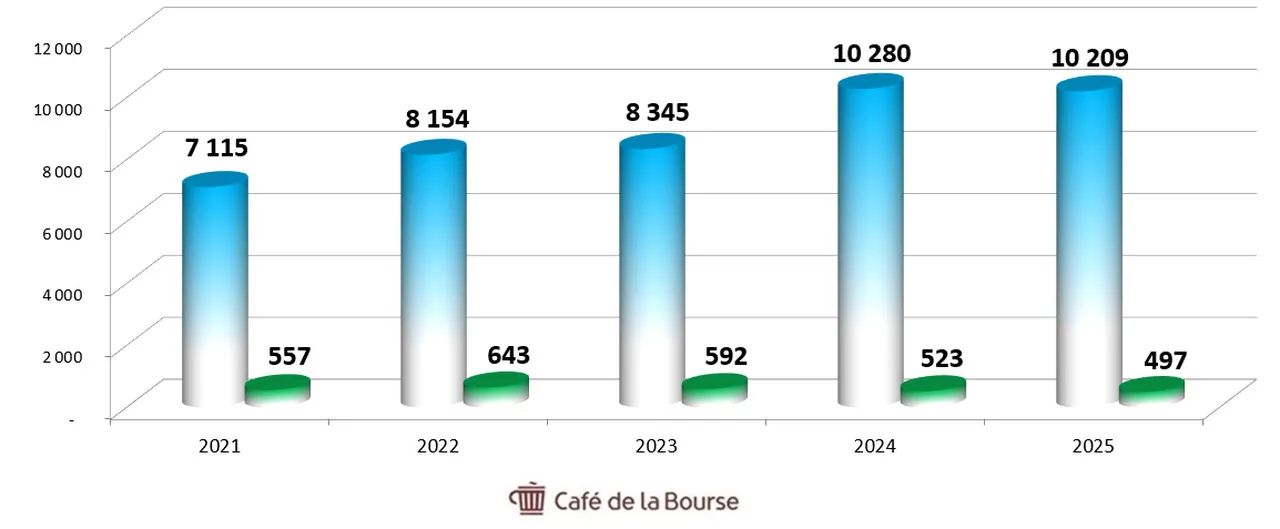
Average profit over 5 years (2021 – 2025): 562.4 million euros
Market capitalization as of 20 October 2026: 4,549 million euros
Average profitability over 5 years: 12.36%
Average P/E over 5 years: 8.09
Teleperformance is a French group, a world leader in outsourced customer relationship management (call centers, customer support, content moderation, and specialized services), employing several hundred thousand people in around fifty countries.
Teleperformance generated 2,812 million euros of cumulative profits over the last five years, i.e., 61.82% of its current market capitalization and 12.36% of its market capitalization on average per year over 5 years.
Revenue and profits of Teleperformance between 2021 and 2025
(in millions of euros, net profit, accounts closed on 31/12)
3. Derichebourg Share: recycling at the service of businesses
Average profit over 5 years (2021 – 2025): 149.2 million euros
Market capitalization as of 20 October 2026: 1,220 million euros
Average profitability over 5 years: 12.23%
Average P/E over 5 years: 8.18
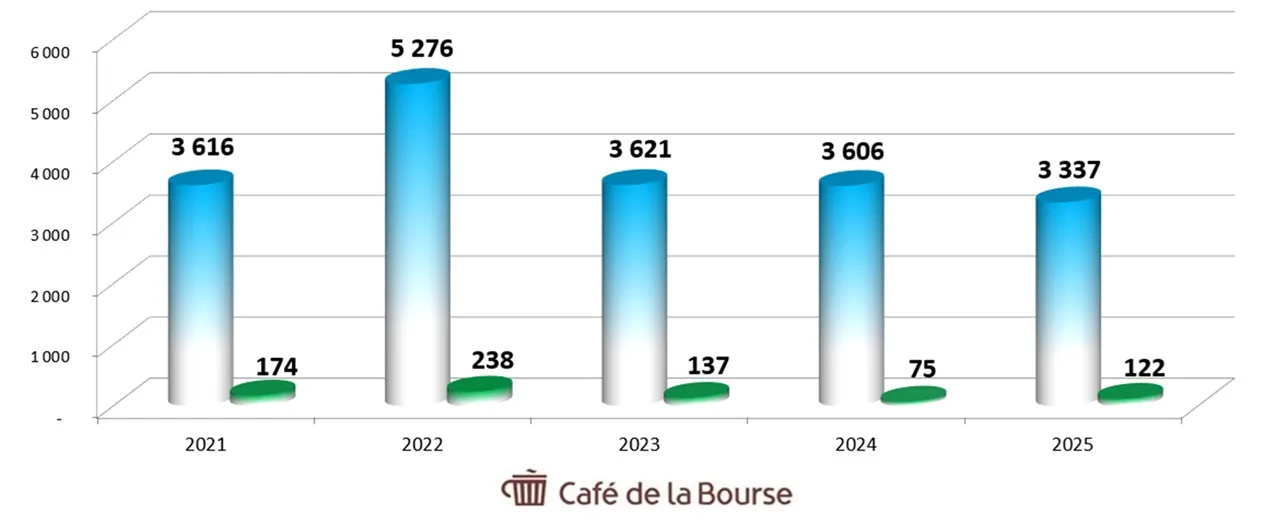
Derichebourg is a large group specialized in the recycling of ferrous and non-ferrous metals as well as waste valorization.
Derichebourg generated 746 million euros of cumulative profits over the last five years, i.e., 61.15% of its current market capitalization and 12.23% of its market capitalization on average per year over 5 years.
Revenue and profits of Derichebourg between 2021 and 2025
(in millions of euros, net profit, accounts closed on 30/09)
4. BNP Paribas Share: European leader of the banking sector
Average profit over 5 years (2021 – 2025): 10,914 million euros
Market capitalization as of 20 October 2026: 95,784 million euros
Average profitability over 5 years: 11.39%
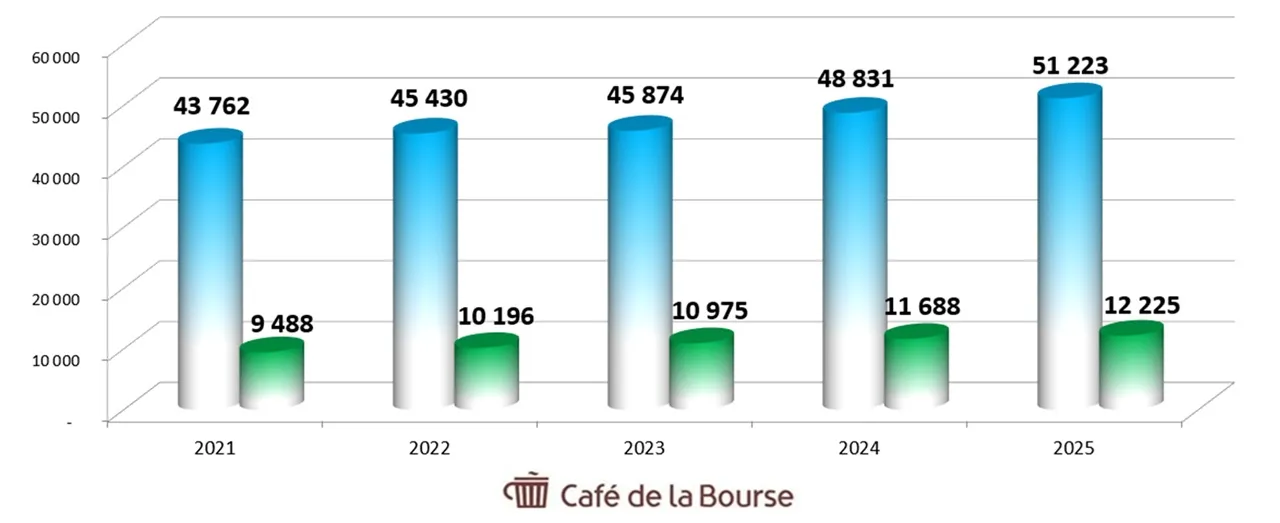
The BNP Paribas group positions itself as a European leader with a 2025 net banking product (Produit Net Bancaire) of 51.2 billion euros.
BNP Paribas generated 54,572 million euros of cumulative profits over the last five years, i.e., 56.97% of its current market capitalization and 11.39% of its market capitalization on average per year over 5 years.
Produit Net Bancaire and profits of BNP Paribas between 2021 and 2025
(in millions of euros, net profit, accounts closed on 31/12)
5. Coface Share: leader in credit insurance
Average profit over 5 years (2021 – 2025): 246.2 million euros
Market capitalization as of 20 October 2026: 2,329 million euros
Average profitability over 5 years: 10.57%
Average P/E over 5 years: 9.46
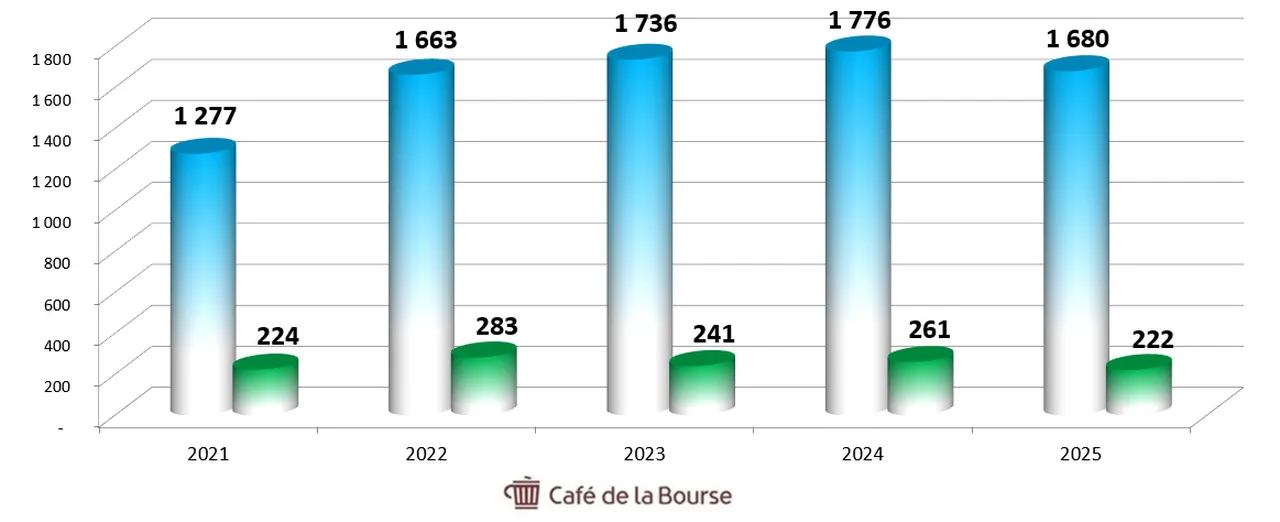
Coface is a French credit insurance group, listed on Euronext Paris, which protects companies against the risk of client non-payment and also offers factoring, debt collection, and information on corporate solvency, with a presence in around a hundred countries.
Coface generated 1,231 million euros of cumulative profits over the last five years, i.e., 52.86% of its current market capitalization and 10.57% of its market capitalization on average per year over 5 years.
Revenue and profits of Coface between 2021 and 2025
(in millions of euros, net profit, accounts closed on 31/12)
6. SEB Share: a large industrial group of small domestic appliances
Average profit over 5 years (2021 – 2025): 326.6 million euros
Market capitalization as of 20 October 2026: 3,223 million euros
Average profitability over 5 years: 10.13%
Average P/E over 5 years: 9.87
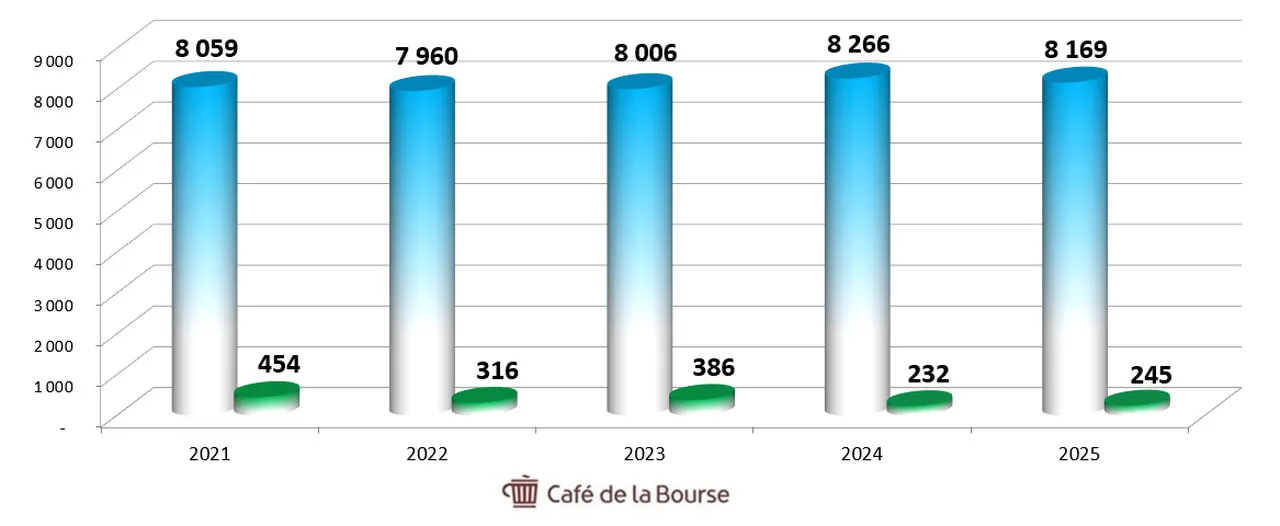
The SEB group is a French industrial company, a world leader in small domestic equipment (cooking, laundry care, home care, and appliances) with brands such as Tefal, Moulinex, Rowenta, Krups, and Lagostina, as well as a professional coffee activity via WMF.
The SEB group generated 1,633 million euros of cumulative profits over the last five years, i.e., 50.67% of its current market capitalization and 10.13% of its market capitalization on average per year over 5 years.
Revenue and profits of the SEB group between 2021 and 2025
(in millions of euros, net profit, accounts closed on 31/12)
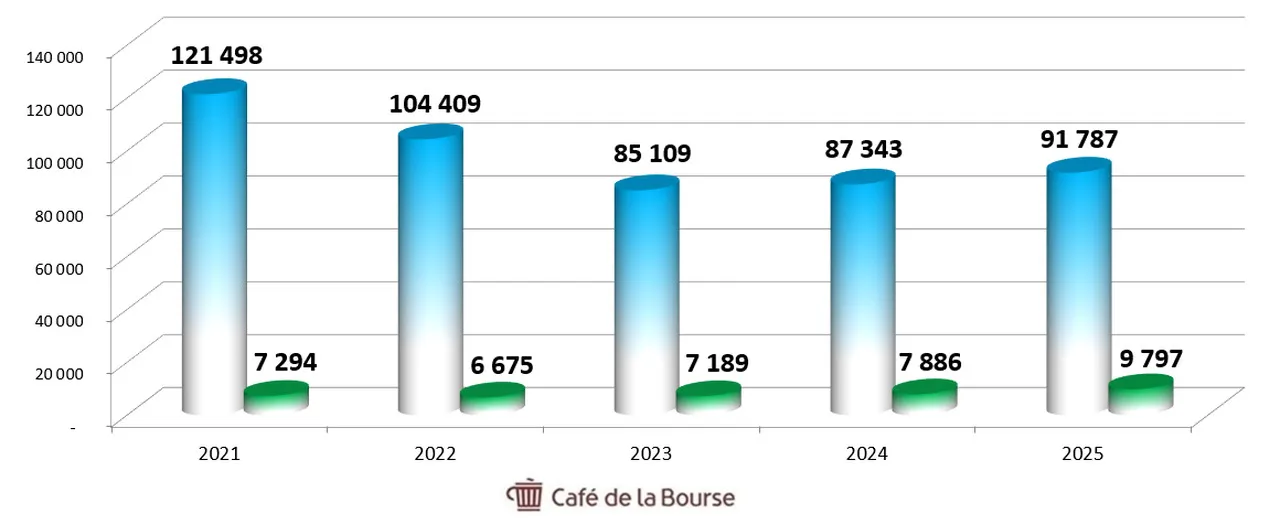
7. AXA Share: among the European leaders in insurance
Average profit over 5 years (2021 – 2025): 7,768 million euros
Market capitalization as of 20 October 2026: 89,602 million euros
Average profitability over 5 years: 8.67%
Average P/E over 5 years: 11.53
AXA is among the world’s largest insurers, with activities in property & casualty, health, life, and asset management (AXA Investment Managers), and clients spread across around fifty countries.
The AXA group generated 38,841 million euros of cumulative profits over the last five years, i.e., 43.35% of its current market capitalization and 8.67% of its market capitalization on average per year over 5 years.
Revenue and profits of AXA between 2021 and 2025
(in millions of euros, net profit, accounts closed on 31/12)
8. Rubis Share: French distributor of petroleum products
Average profit over 5 years (2021 – 2025): 312.2 million euros
Market capitalization as of 20 October 2026: 3,654 million euros
Average profitability over 5 years: 8.54%
Average P/E over 5 years: 11.70
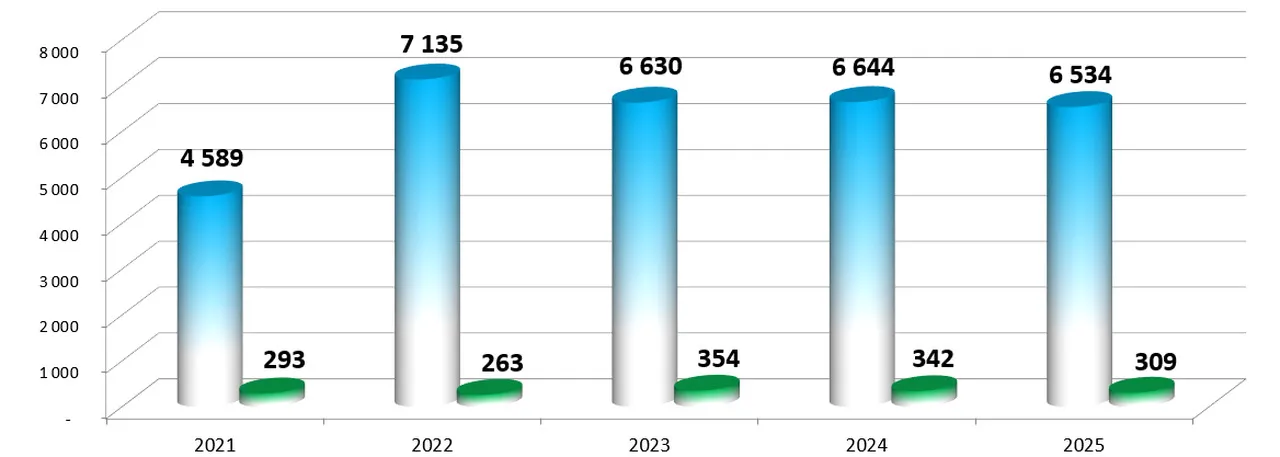
Rubis is a French group specialized in the distribution of petroleum products (fuels, LPG, bitumen, lubricants) and the storage of liquid products, mainly in Africa, the Caribbean, and the Indian Ocean, with also a renewable electricity production activity via Rubis Photosol.
The Rubis group generated 1,561 million euros of profits cumulatively over the last five years, i.e., 42.72% of its current market capitalization and 8.54% of its market capitalization on average per year over 5 years.
Revenue and profits of the Rubis group between 2021 and 2025
(in millions of euros, net profit, accounts closed on 31/12)
What is the P/E ratio of our Top 8 compared to the P/E of CAC 40 companies?
Our selection of 8 companies presents an average P/E ratio of 9.31 smoothed over 5 years (2021-2025). By comparison, as of October 20, 2026, the CAC 40 shows a current P/E ratio of 21.13.
| Company | Stock Price (€) | P/E 2025 |
| Accor | 46,790 | 25,489 |
| Air Liquide | 172,240 | 29,863 |
| Airbus | 193,580 | 28,864 |
| AXA | 42,850 | 11,132 |
| BNP Paribas | 86,950 | 8,703 |
| Bouygues | 40,650 | 13,883 |
| Bureau Veritas | 27,720 | 19,606 |
| Capgemini | 123,000 | 9,371 |
| Carrefour | 16,300 | 10,381 |
| Crédit Agricole | 15,245 | 7,209 |
| Danone | 61,020 | 16,200 |
| Dassault Systèmes | 23,190 | 17,634 |
| Eiffage | 98,160 | 9,169 |
| Engie | 22,830 | 15,510 |
| EssilorLuxottica | 150,500 | 31,004 |
| Eurofins Scientific | 79,000 | 21,038 |
| Euronext | 168,800 | 23,222 |
| Hermès International | 1 339,000 | 31,054 |
| Kering | 216,400 | 50,104 |
| L’Oréal | 403,950 | 32,054 |
| Legrand | 127,300 | 26,234 |
| LVMH | 386,750 | 18,162 |
| Michelin | 33,240 | 14,267 |
| Orange | 14,290 | 16,936 |
| Pernod Ricard | 66,960 | 9,526 |
| Publicis Groupe | 100,950 | 13,697 |
| Renault | 27,740 | n.s. |
| Safran | 312,900 | 41,711 |
| Saint-Gobain | 67,140 | 9,931 |
| Sanofi | 73,580 | 9,188 |
| Schneider Electric | 244,300 | 29,488 |
| Société Générale | 62,060 | 9,481 |
| Stellantis | 3,834 | n.s. |
| STMicroelectronics | 41,005 | 92,668 |
| Thales | 230,100 | 28,782 |
| TotalEnergies | 79,940 | 13,892 |
| Unibail-Rodamco-Westfield | 88,660 | 9,376 |
| Veolia | 32,020 | 14,400 |
| Vinci | 106,500 | 12,491 |
Note, P/E ratios are not the only criteria to study when analyzing companies; many other parameters must be considered (outlook, growth, valuation, debt, dividends, etc.)
The information from Cafedelabourse.com and its publications is provided for educational purposes. They do not constitute investment recommendations. The reader should study the risks before undertaking any transaction. They are solely responsible for their investment decisions.
Past performance is not indicative of future results. Investing in equities carries a risk of capital loss.
All our information is, by nature, generic. It does not take into account your personal situation and does not constitute personalized investment advice or any inducement to buy or sell financial instruments. The reader is solely responsible for the use of the information provided, and Cafedelabourse.com cannot be held liable. The publisher cannot be held liable for any error, omission, or inappropriate investment.
