
When you want to invest in the stock market, buy a stock and never sell it: this is the strategy that built several of the greatest stock market fortunes, from Warren Buffett with Coca-Cola to Hermès’ family shareholders. A company that reinvests its profits at a high return, year after year, sees its value grow exponentially, and the shareholder who stays on board benefits without transaction costs or taxes on capital gains realized too early.
By the end of 2026, the exercise becomes more demanding: many quality values trade at more than 30 times their earnings, and tariffs or the race for artificial intelligence have caused brutal swings in some listed shares. Retail investors are then tempted to enter and exit the market, often losing returns by doing so at the wrong time.
In Buy and Hold, the main question is whether the company will be bigger and more profitable in ten or twenty years. Three long-term trends help answer this in 2026: demand for industrial gases, driven by semiconductor plants and hydrogen; the growth of air traffic, which has surpassed pre-COVID levels and keeps a globally expanding fleet turning; and the electrification of the economy, accelerated by data centers and the energy transition.
We looked for “compounders,” companies capable of growing their capital over the very long term, that benefit from these trends.
This selection is educational in nature and does not constitute personalized advice. Past performance does not predict future results.
How Café de la Bourse selected French stocks to never sell?
The “forever-hold” stock selections are often limited to dividend aristocrats. Our criteria instead emphasize a company’s ability to reinvest its profits at a high return, and the dividend is not eliminatory. We examined seven axes:
- Return on capital : ROIC or ROCE at least 15% on average
- Steady growth : revenue growth of at least 5% per year and earnings per share growth of at least 7% per year over 10 years
- Pricing power : stable or expanding operating margin, including during the 2022-2023 inflation
- Durable competitive advantage : an identifiable moat (network, installed base, standards, switching costs)
- Healthy balance sheet : net debt below 2x EBITDA
- Recovery capability : price returns to its previous high less than 5 years after the 2008 crisis and after the 2020 crisis
- Capital allocation : track record of value-creating acquisitions, share buybacks and growing dividends
We also kept a minimum market capitalization of €15 billion and limited the selection to French stocks, all eligible for the PEA. None tick all the boxes: Air Liquide tops the list as the stock that has best withstood crises, with the most regular dividend. Safran follows, with the strongest growth and net cash, but more volatile. Schneider Electric closes the field: its activity is accelerating, but the PTC acquisition will weigh on its debt.
Over 10 years, with dividends reinvested, the three stocks have yielded between 14.6% and 17.8% per year (writer’s calculation based on Yahoo Finance data, early November 2026). This past does not guarantee future results.
Build your own selection of best stocks on the stock market. With Café de la Bourse’s stock screener, you can filter nearly 900 French, European and American stocks according to around sixty criteria (ROIC, revenue and EPS growth, debt, margins, dividend, PEA eligibility…) and bring out your own candidates. The Quality Café de la Bourse thematic portfolio, which includes a ROIC of at least 15% and revenue and EPS growth of at least 8% per year over 5 years, is a good starting point for this strategy.
Air Liquide stock: the metronome of industrial gases
Air Liquide produces and distributes the gases that industry, hospitals and semiconductor plants need daily: oxygen, nitrogen, hydrogen, rare gases. The French group forms with the German Linde a global oligopoly, and most of its major customers are bound by long-term contracts, often fifteen years, with minimum guaranteed volumes. This steadiness earns it the nickname of the “metronome” of the Paris stock market.
What are Air Liquide’s key figures?
| Indicator | Value |
| Revenue 2025 | €26.9 billion |
| Net income 2025 (group share) | €3.52 billion; recurring €3.68 billion |
| Free cash-flow 2025 | €2.7 billion (after €3.8 billion invested) |
| EBITDA (12 months trailing) | around €8.3 billion (EBITDA margin 30.84%) |
| Market capitalization (3 November 2026) | €115.8 billion |
| Dividend per share / Yield | €3.70 / 1.85% |
| Revenue growth YoY | -0.4% reported; +2.0%like-for-like |
| Revenue growth last quarter (YoY) | +10.0% reported; +3.0% like-for-like |
Revenue for 2025 falls slightly on a reported basis (-0.4% to €26.9 billion), penalized by currency effects and the drop in energy prices, which the group passes through to its customers. On a comparable basis, it grows by 2.0%. Profitability improves further: the operating margin rises 80 basis points to 20.7%, and recurring net income increases by 6.2% to €3.68 billion.
The free cash-flow appears modest (€2.7 billion, per Yahoo Finance) because Air Liquide invests massively: €3.8 billion in 2025, financed by a financing capacity of €6.9 billion, in plants built for already-signed customers.
Net debt stands at €8.4 billion at end-2025 and represents 1.18x EBITDA (Café de la Bourse screener). The recurring ROCE published by the group reaches 11.2%, up 0.5 point; the ROIC calculated by the screener is lower, at 9.1%. Over ten years, revenue has risen from €16.4 billion in 2015 to €26.9 billion in 2025, about 5% per year, helped by the 2016 acquisition of American Airgas (annual reports, writer’s calculations). The 2025 dividend grows 12.1%, to €3.70 per share, and in 2026 the group granted a free share award for ten held.
What are Air Liquide’s latest results?
Published on 29 October 2026, third-quarter revenue reaches €7,259 million, up 10.0% on a reported basis (including a +4.2% energy effect) and up 3.0% on a comparable basis, above consensus of €7.11 billion.
Comparable growth accelerates quarter after quarter in the Gas & Services business, which accounts for more than 97% of sales: +1.9% in Q1, +3.3% in Q2, +3.6% in Q3. Electronics, driven by semiconductor plants, grows 12% and Industrial Commercial 5.3%. Investment decisions reach a record level of €4,133 million in nine months.
In the first half (reported July 28), operating margin reached 20.9%, up one point. On October 5, during its investor day, Air Liquide presented its Beyond strategic plan to 2030: an average annual growth in recurring EPS of about 10% (±2 percentage points), an increase in operating margin by 400 to 600 basis points, €40 billion of capital to allocate and, for the first time in its history, a €4 billion share buyback program in 2027-2028.
The 2026 and 2027 targets are confirmed.
What are Air Liquide’s key financial ratios?
| Ratio | Value | Industry reading |
| P/E (Price/Earnings) | 31.2 (28.1 on expected earnings) | Premium for earnings stability |
| P/FCF | 33.4 (FCF yield 2.99%) | Highest of the three, due to record investments |
| EV/EBITDA | 11.5 | Lowest of the three stocks |
| Dividend yield | 1.85% | Highest of the three stocks |
| payout ratio | 62.3% | Highest of the three values |
Air Liquide trades at about 31 times its published earnings and 28 times those expected, a high level for a company whose revenue grows by 2-3% on a like-for-like basis. The market pays for earnings stability, and the Beyond plan promises an acceleration in earnings-per-share growth.
The high P/FCF reflects a sustained investment cycle, more a good sign in Buy and Hold if these projects deliver profitability: the target ROCE above 11% in 2030 will be the indicator to watch.
The dividend is Air Liquide’s hallmark, paid uninterrupted for at least 27 years (Café de la Bourse screener) and distributing about 62% of earnings. Shareholders registered on the nominative basis for more than two years also benefit from a loyalty premium of 10% on the dividend and on free share allocations, a benefit designed for long-term investors.
Find all Air Liquide’s financial ratios (valuation, profitability, growth, balance-sheet strength) and its Café de la Bourse Score on Air Liquide’s screener page.
How far can Air Liquide stock go? Technical analysis and Café de la Bourse view
Over twelve months, the trend for Air Liquide has been upward. Starting from around €141 in December 2025, the stock posted higher lows, consolidated between €164 and €181 during the summer, then accelerated at the end of October to €182.20 on November 3, its high of the year.
Moving averages are aligned in an uptrend: the price sits above the 20-day moving average at €173.73, which itself sits above the 50-day moving average at €170.65 and the 200-day moving average at €165.58. All three are rising, and the 10% gap from the 200-day moving average remains reasonable.
The MACD confirms the momentum: the MACD line (2.94) is above its signal line (1.98), and the green histogram (0.96) has been growing since early October.
The stock tests the resistance at €181.30, which corresponds to the July high. Supports are at €172.56, the previous April and September ceiling, close to the 20-day moving average, then at €164.06, June and September lows, near the 200-day moving average.
Bullish scenario: a durable close above €181.30 would place the stock on new highs, with no obvious resistance above. Bearish scenario: a break below €181.30 would bring the stock back toward €172.56, then €164.06 if the decline deepens.
How to invest in Air Liquide stock? Café de la Bourse view
Key opportunities
The Beyond plan provides a numerical roadmap through 2030: recurring EPS growing by about 10% per year and operating margin rising by 400 to 600 basis points. Among the four targeted markets (electronics and AI, energy transition, home healthcare, space), Electronics already grows 12% in Q3. The first-ever share buyback program for the group, €4 billion in 2027-2028, adds to a dividend increase of 12.1% this year and to the loyalty premium for nominative shareholders.
Main risks
Revenue growth remains slow: +2.0% on a like-for-like basis in 2025. Most earnings growth comes from efficiency gains, which are not endless. The ROIC, at 9.1% according to Café de la Bourse’s screener (11.2% recurring ROCE per the group), remains below our 15% threshold, and the plan only targets ROCE above 11% by 2030. The business depends on the health of industry, particularly in Europe where chemistry and steelmaking are under pressure. Finally, the stock trades near its yearly highs: the presence of activist Elliott in the capital supports expectations, leaving little room for disappointment.
Our final view on Air Liquide stock
Air Liquide is the most defensive stock in our selection of French stocks to never sell in the stock market: the one that best withstood the crises of 2008 and 2020, with a beta of 0.64 (Café de la Bourse screener). It suits a patient investor seeking steadiness more than rapid growth. Valuation, near 31x earnings, suggests dividing purchases over time rather than investing all at once (DCA plan). Next events: the 2026 annual results in February 2027, and the launch of the buyback program in 2027.
This view is not a personalized investment advice. All investments carry a risk of capital loss.
Safran stock: the engine maker that earns money every flying hour
Safran manufactures, with GE Aerospace in the joint venture CFM International, the CFM56 and LEAP engines that equip a large portion of the Airbus A320 and Boeing 737 in service. It is also a global leader in landing gear and carbon brakes, and every engine sold subsequently generates 30 years of spare parts and maintenance revenue.
What are Safran’s key figures?
| Indicator | Value |
| Revenue 2025 (adjusted) | €31.3 billion |
| Net income 2025 (adjusted, group share) | €3.17 billion |
| Free cash-flow 2025 | €3.92 billion |
| EBITDA (12 months trailing) | about €5.9 billion (EBITDA margin 17.44%) |
| Market capitalization (2 November 2026) | €115.9 billion |
| Dividend per share / Yield | €3.35 / 1.22% |
| Revenue growth YoY | +15% |
| Revenue growth last quarter (YoY) | +14.7% (+13.4% organic) |
In 2025, adjusted revenue grows by 15% to €31.3 billion, and current operating income jumps 26% to €5.2 billion. Operating margin increases by 1.5 percentage points to 16.6% of revenue, indicating the group passes higher costs through to prices. On rolling 12 months published data, the operating margin stands at 12.7% and ROIC at 12.8%, below our 15% threshold (Café de la Bourse screener).
Free cash-flow reaches €3.92 billion, up 23%, and Safran ends the year with net cash of €1.74 billion: the group has no net debt. This strength funds a €5 billion share buyback program and a 16% dividend increase to €3.35 per share.
The IFRS net income (€7.2 billion per Yahoo Finance) is boosted by the accounting of currency hedges; the adjusted result better reflects activity. Over ten years, adjusted revenue has risen from about €17.4 billion in 2015 to €31.3 billion in 2025, a growth of around 6% per year (Safran annual reports, writer’s calculations), aided by the Zodiac Aerospace acquisition in 2018.
What are Safran’s latest results?

Safran had raised its targets on 28 July 2026, after a solid first half: current operating income €3.24 billion (+29%, margin 18.4%) and free cash-flow €2.62 billion, versus €2.05 billion expected.
End-October 2026, Safran’s third-quarter revenue reached €9,003 million, up 14.7% year over year and 13.4% organic. It slightly beat consensus which expected €8.99 billion. The Propulsion division rose 13.2% organically, driven by aftermarket (+18.7%). LEAP engine deliveries reached 535 units, up 5%.
Yet the market focused on the slowdown in civil spare parts: +29.3% in Q1, +26.7% in Q2, then +17.0% in Q3 (in dollars). To hit the annual target of around +25%, a Q4 above 25% is required, and this doubt sent the stock down about 9% in the session.
The 2026 objectives are confirmed: revenue growth of around 15%, current operating income of €6.4-6.5 billion and free cash-flow of €4.7-4.9 billion. Full-year results are expected February 9, 2027.
What are Safran’s key financial ratios?
| Ratio | Value | Industry reading |
| P/E (Price/Earnings) | 29.6 (26.6 on expected earnings) | Revenue at a more moderate level after the rise |
| P/FCF | 27.7 (FCF yield 3.61%) | Reasonable given cash growth |
| VE/EBITDA | 21.9 | Highest of the three values |
| Dividend yield | 1.22% | Covered by €5 billion buybacks |
| payout ratio | 35.8% | Stable and predictable policy |
After a strong rise since 2022, Safran trades at ~30x its published earnings and ~27x expected earnings. Its EV/EBITDA of 21.9 is the highest among our three stocks. The stock’s decline from its summer high (€366.50) has brought the valuation to more reasonable levels.
If free cash-flow hits the 2026 objective of €4.7-4.9 billion, the P/FCF falls from about 28 to 24 (writer’s calculation). With positive net cash, the balance sheet does not weigh on valuation, and a payout ratio around 36% leaves room to fund both R&D (the RISE engine program for the next generation of aircraft) and shareholder returns.
Compare Safran with other aerospace and defense stocks through its full Café de la Bourse Invest page: detailed ratios, Café de la Bourse Score and price history.
How far can Safran stock go? Technical analysis and Café de la Bourse view
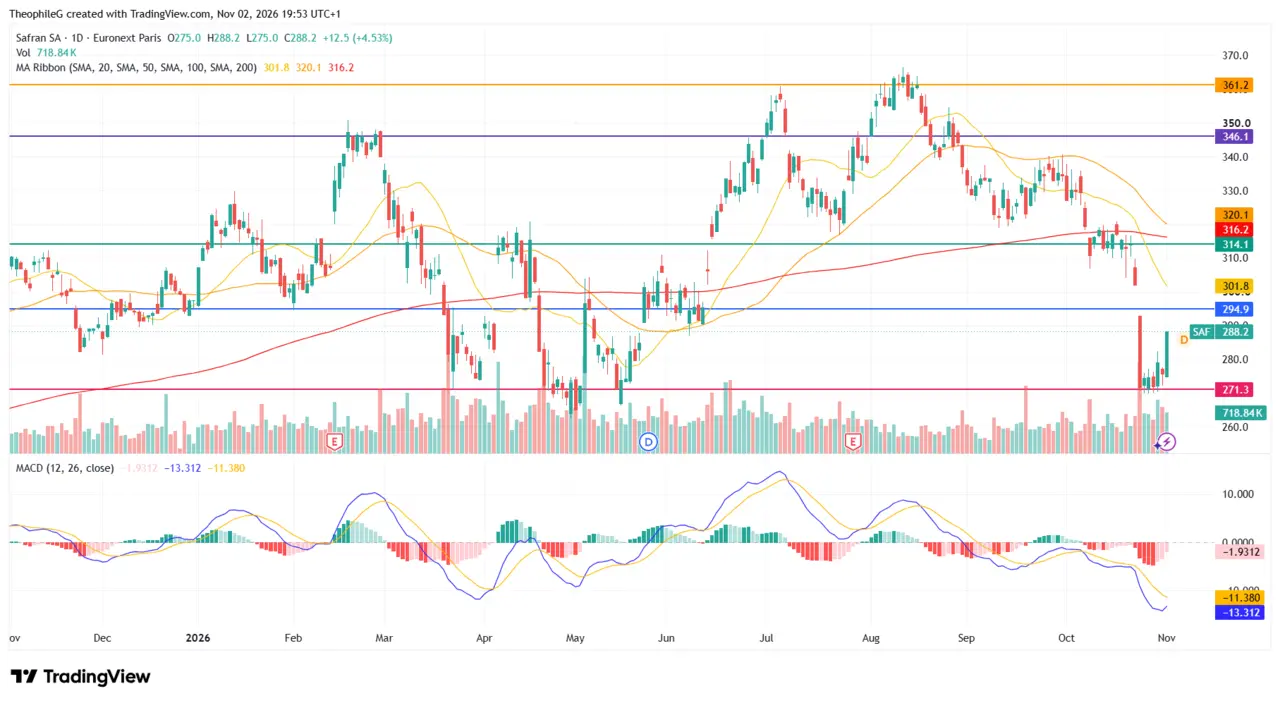
Over twelve months, Safran’s share price has ranged between €271 and €366. After its summer highs around €361, it entered a downtrend in September, and the third-quarter release triggered at the end of October a price gap lower, with heavy volumes.
The price (€288.20 at the close on November 2) sits below its three moving averages: the 20-day MA at €301.8, the 50-day MA at €320.1 and the 200-day MA at €316.2. The 20-day MA has crossed below the 200-day MA, confirming a near-term deterioration. The 200-day MA, however, remains upward for the year.
The MACD is negative: the MACD line (-13.31) is below its signal line (-11.38). The histogram turned green again recently (0.18) — in a very low zone, this cross often signals an end to the downside momentum.
The stock stabilized around the capital increase price (€240). The major support sits at €271.3, which stopped the decline in April-May and again at the end of October, and the session on November 2 (+4.53%) marks a first rebound from this level. The first resistance sits at €294.9, then around €314.1, a zone that coincides with the 200-day moving average.
Bullish scenario: a breakout above €294.9 would open the path to the 20-day MA (€301.8) and then to €314.1. Bearish scenario: a break below €271.3 would expose the stock to its yearly lows, toward €262.6.
How to invest in Safran stock? Café de la Bourse view

Key opportunities
The LEAP engine fleet in service continues to grow each year and most engines have not yet undergone their first major shop visits. Maintenance and spare parts revenues should therefore continue to rise for decades, with margins well above those of new engine sales. Delivery delays from Airbus and Boeing extend the life of the CFMs in service, a major revenue stream for parts, and the RISE program prepares the next generation. Finally, net cash and the free cash-flow target of €4.7-4.9 billion in 2026 fund buybacks and a rising dividend.
Key risks
The aerospace cycle remains cyclical. In 2020, Safran’s stock fell nearly 65% and took three and a half years to regain its high. Airbus and Boeing production rates, slowed by supply chains, condition new engine deliveries. The group is exposed to the dollar, despite hedging, and the French state remains a reference shareholder, which may weigh on certain strategic decisions.
Our final view on Safran stock
Each Safran engine sold today should generate maintenance revenue for around thirty years. Fundamentals are solid (net cash, rising margins, raised targets), but the short-term technical trend remains bearish as long as Safran trades below its moving averages. A Buy and Hold investor could view the €271 zone as a support to watch, and the reconquest of the 200-day MA (€316) as a signal of a rebound. Next event: the annual results on February 9, 2027.
This view is not a personalized investment advice. All investments carry a risk of capital loss.
Schneider Electric stock: the French architect of electrification

Schneider Electric designs equipment and software that distribute, control and optimize electricity, from a domestic electrical panel to the full power supply of a data center. The group derives the bulk of its activity from energy management and has become one of the major winners in AI investments.
What are Schneider Electric’s key figures?
| Indicator | Value |
| Revenue 2025 | €40.2 billion |
| Net income 2025 (group share) | €4.16 billion; €4.83 billion adjusted |
| Free cash-flow 2025 | €4.6 billion (record) |
| EBITDA (12 months trailing) | around €8.9 billion (EBITDA margin 21.10%) |
| Market capitalization (2 November 2026) | €140.0 billion |
| Dividend per share / Yield | €4.20 / 1.77% |
| Revenue growth YoY | +8.9% organic (+5.2% reported) |
| Revenue growth last quarter (YoY) | +17.9% (+16.9% organic) |
Schneider Electric exceeded €40 billion in revenue for the first time in 2025, with organic growth of 8.9%. Adjusted EBITA reaches €7.52 billion, up 12.3% organically, with the margin rising to 18.7%. Free cash-flow sets a record at €4.6 billion (+10%), with net cash conversion of 111%.
Published net income falls 2% to €4.16 billion, but adjusted earnings rise 4% to €4.83 billion (adjusted EPS €8.59). The dividend increases by 8% to €4.20.
Over ten years, published growth is more modest: revenue rose from about €26.6 billion in 2015 to €40.2 billion in 2025, roughly 4.2% per year (Schneider Electric annual reports, writer’s calculations). Recent organic growth is much stronger, but the decade-average published growth remains below our 5% threshold.
Before the PTC acquisition, net debt stood at 1.85x EBITDA, below our 2x threshold. ROIC at 11.3% remains below our 15% target (Café de la Bourse screener). The group has paid a dividend uninterrupted for 27 years.
What are Schneider Electric’s latest results?
Published on 16 October 2026, Schneider Electric’s Q3 revenue reached a record €11.46 billion, up 17.9% on published data and 16.9% organically. Analysts expected €11.13 billion and 13.8% organic growth: a clear surprise.
Energy Management grows 19% organically, North America 20%, and China & East Asia 26%.
For the second time that year, the group raised its 2026 targets: now aiming for organic revenue growth of 12-14% (versus 10-13%) and organic adjusted EBITA growth of 18-21% (versus 14-19%).
These good numbers were nonetheless eclipsed by another announcement. On 5 October, Schneider revealed the acquisition of U.S. software maker PTC for about $22.6 billion (roughly €20.1 billion). To partly finance it, the group raised about €6 billion on 19 October by issuing new shares at €240 (a 4.99% discount), representing 4.32% of the capital. The remainder would be funded by debt. The closing is expected in Q3 2027.
What are Schneider Electric’s key financial ratios?
| Ratio | Value | Industry reading |
| P/E (Price/Earnings) | 28.2 (23.0 on expected earnings) | Lowest among the three values |
| P/FCF | 26.1 (FCF yield 3.83%) | Lowest among the three values |
| VE/EBITDA | 18.5 | Middle of the three values |
| Dividend yield | 1.77% | Close to Air Liquide |
| Payout ratio | 49.9% | Balanced |
After a strong rise since 2022, Schneider Electric trades at around 23x its published earnings and 23x expected earnings. Its EV/EBITDA of 18.5 is mid-range among the three stocks. The fall from the August high has brought the valuation to more reasonable levels.
If the free cash-flow reaches the €4.7-4.9 billion target in 2026, the P/FCF decreases from about 28 to 24 (writer’s calculation). With positive net cash, the balance sheet does not weigh on valuation, and a payout ratio around 49% leaves room to fund both R&D (the Rise engine program for the next generation of aircraft) and shareholder returns.
Compare Schneider Electric with the other aerospace & defense and industrials stocks on its dedicated Café de la Bourse Invest page: ratios, CdB Score and price history.
How far can Schneider Electric stock go? Technical analysis and Café de la Bourse view
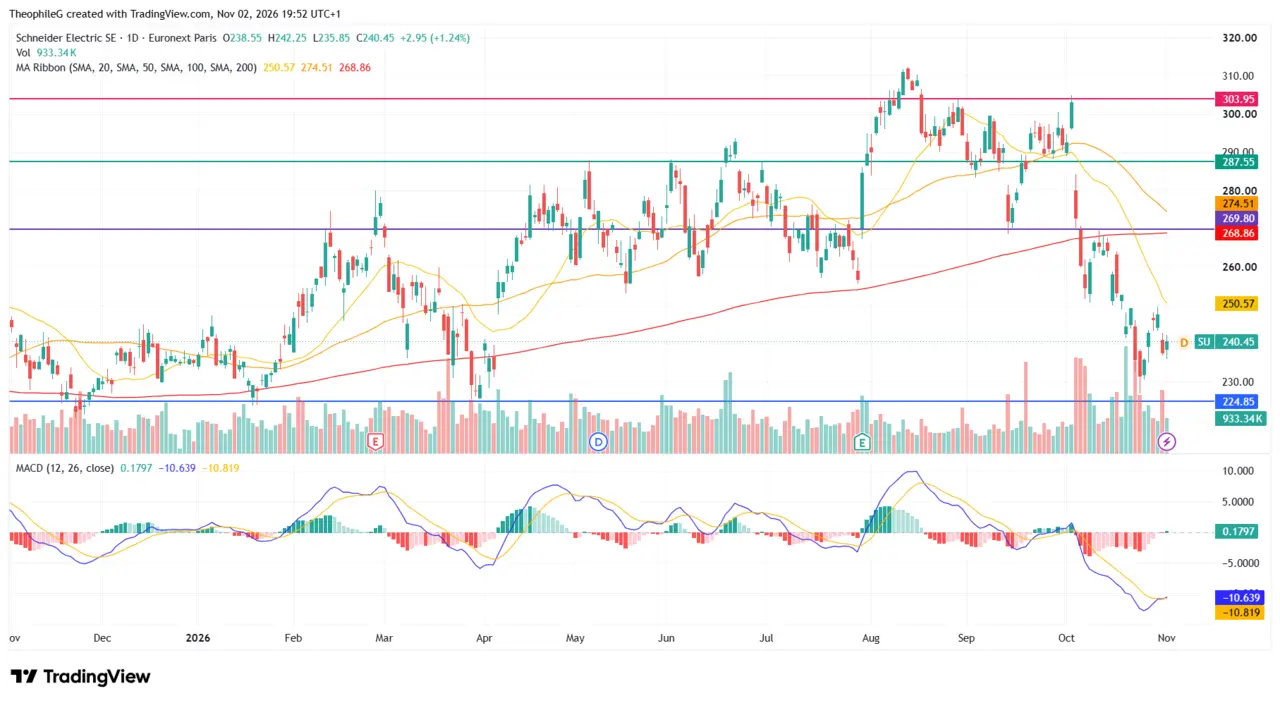
Over twelve months, Schneider Electric’s stock rose from €225 in January to around €312 by mid-August, peaked near the resistance at €303.95, then fell in October with the PTC acquisition and capital increase, on strong volumes.
The price (€240.45 as of November 2) sits below its three moving averages: the 20-day MA (€250.57), the 50-day MA (€274.51) and the 200-day MA (€268.86). The 20-day MA has crossed below the 200-day MA, but the 200-day MA remains slightly upward, suggesting a correction within a still-positive long-term trend.
The MACD sends an initial encouraging signal. The MACD line (-10.64) has just crossed back above its signal line (-10.82), and the histogram is turning slightly positive (0.18): in a very low zone, this cross often signals a pause in the decline.
Schneider Electric has stabilized around the capital increase price of €240. The major support sits at €224.85, corresponding to January lows. Above, resistance sits at the 20-day MA (€250.57), then at €269.80, the area of the 200-day MA, then at €287.55.
Bullish scenario: reclaiming the 20-day MA (€250.57) would open the path to €269.80, where the 200-day MA would serve as a decisive test. Bearish scenario: a break below €224.85 would erase the 2026 gains and change the long-term outlook.
How to invest in Schneider Electric stock? Café de la Bourse view
Key opportunities
Data centers are the primary driver: every AI-focused site consumes huge amounts of electricity, and Schneider provides both the hardware and software to distribute and manage it. Electrification of buildings, industry and transport extends this demand well beyond the AI cycle. The PTC acquisition strengthens the software share, which is more recurring and more profitable. The EBITA margin is rising steadily, reflecting genuine pricing power, and its P/E is the lowest of our three stocks.
Main risks
The primary risk is executing the PTC acquisition. Paying around €20 billion for a software publisher is a major bet, increasing debt and diluting shareholders by more than 4%. The market punished the deal, and it will take several years to judge whether the price paid creates value. A second risk is growing dependence on data centers: a slowdown in AI investments could slow the most visible growth. Finally, Schneider remains more sensitive to the business cycle than the other two, with a beta of 1.13 (Café de la Bourse screener).
Our final view on Schneider Electric stock
Schneider Electric targets in 2026 organic revenue growth of 12-14% and has the lowest P/E of our selection of French stocks to never sell in the stock market. The October drop reflects the price paid for PTC, while activity accelerates. Graphically, the support at €224.85 and the MACD bullish cross are the two reference points to monitor, while a reclaim of the 20-day MA (€250.57) would confirm stabilization. Next event: the 2026 annual results due in February 2027.
This view is not a personalized investment advice. All investments carry a risk of capital loss.
How to invest in French stocks to never sell in practice?

The first question is the wrapper. Air Liquide, Safran and Schneider Electric are French companies, all eligible for the PEA. This wrapper is often the most suitable for a Buy and Hold of a company to keep over the very long term: after five years, capital gains and dividends are exempt from income tax and only the social contributions of 18.6% apply, and dividends can be reinvested into the plan without tax friction. On a regular stock account, capital gains and dividends fall under the flat tax of 31.4%.
The mode of ownership also matters, especially for Air Liquide. Shares registered in nominative form (purely, directly with the company, or administered, via your broker) for more than two years entitle you to a loyalty premium of 10% on the dividend and on the allocation of free shares. Not all banks and stockbrokers offer nominative administration within a PEA: check to choose the best stockbroker.
Prefer limit orders and avoid the first minutes of trading (Euronext Paris opens at 9 am), when the bid-ask spread is widest.
Nothing requires you to invest the entire sum at once. Splitting purchases over several months (systematic investment or DCA) limits the risk of entering at a peak, which is useful while Air Liquide trades near its annual highs and Safran and Schneider Electric remain in a short-term downtrend.
Finally, the three stocks in our selection of French stocks to never sell span three distinct sectors (industrial gases, aerospace, electrical equipment), but all are French and command high valuations. A broader geographic diversification, via around twenty active stocks and ETFs, is advisable, and brokerage and account maintenance fees should be compared to open the best PEA or the best stock account.
This selection is educational in nature and does not constitute personalized investment advice. Past performance does not predict future results.
Go further with Café de la Bourse portfolios
The Air Liquide, Safran and Schneider Electric stocks are only three examples of stocks to never sell in the stock market according to Buy and Hold. To build a portfolio tailored to your profile, explore Café de la Bourse’s eight thematic portfolios: Quality, Good Father of the Family, Aristocrats of Dividends, Defensive Values, Value Investing, Tricolore France, Growth Technology Stocks, and ESG. Each applies numerical criteria and displays its risk profile.
Each stock receives a Café de la Bourse Score from 0 to 10 (valuation, dividend, financial strength, growth), freely accessible; a subscription provides access to detailed ratios, a watchlist and your saved filters.
Discover Café de la Bourse screener and portfolios to build your own long-hold stock selection.
Information from Cafedelabourse.com and its publications is provided for educational purposes. It does not constitute investment recommendations. The reader should study the risks before executing any transaction. The reader is solely responsible for their investment decisions.
Past results do not guarantee future results. Investing in stocks involves the risk of capital loss.
All our information is, by its nature, generic. They do not take into account your personal situation and do not constitute personalized investment recommendations in view of transactions and cannot be equated with investment advisory services. The reader is solely responsible for using the information provided, with no recourse against Cafedelabourse.com. The publisher Cafedelabourse.com cannot be held liable for any error, omission or unsuitable investment.
